Introducing Netmap - Network Activity at Online.net
Today we are excited to share with you our new network weather map.
Lately, we totally reworked the previous network activity map website with some new features. These changes provide more details on the Online's network activity in the most transparent way and offer much convenient experience.
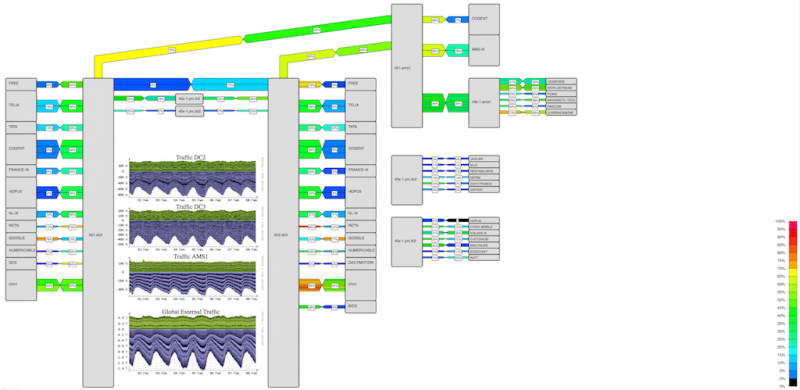
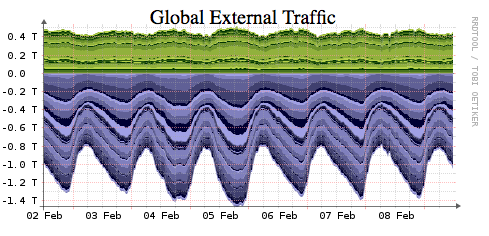
The new network map website provides many information about the Online.net network: It shows the aggregate bandwidth IN & OUT graphs for each datacenter and global external traffic. You can consult the current network activity of each router room in DC2, DC3 and AMS1. You can also get the current activity for each transit link.
We use networkmap.js, a network weather map written in Javascript for the UI. That allowed us to provide the map directly in the browser.
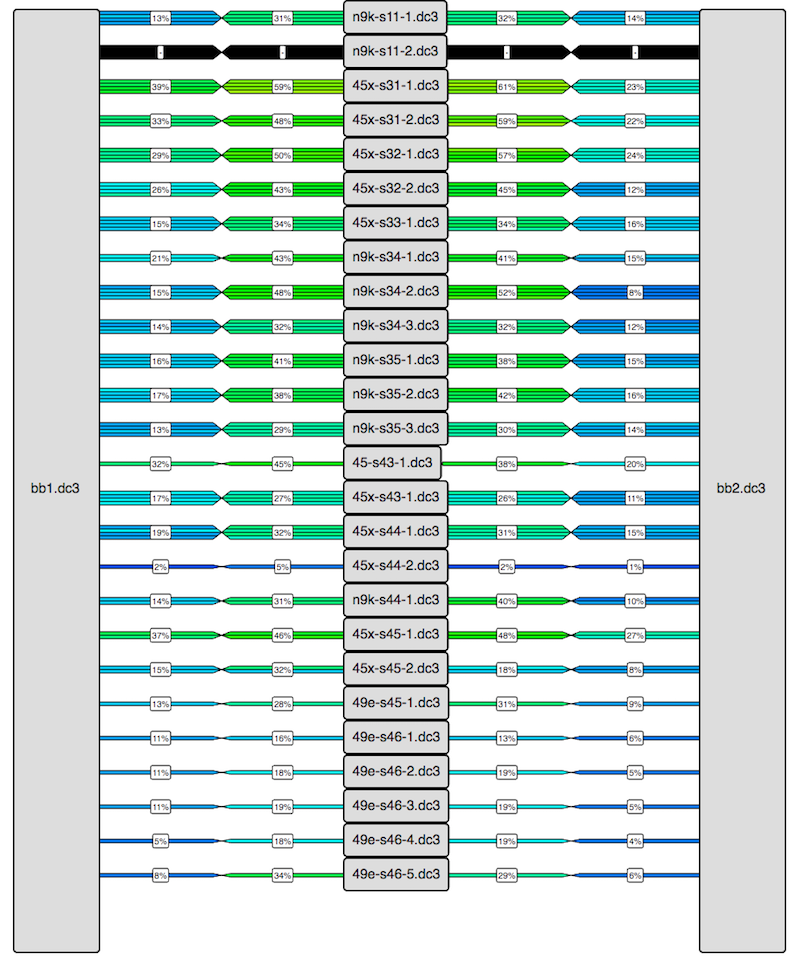
Transit links are displayed in three different sizes:
We hope you will love this new network wheather map. We'd like to know your opinion, feedback and answer your questions about Netmap, so please leave us a comment here or join us on the community platform.
Lately, we totally reworked the previous network activity map website with some new features. These changes provide more details on the Online's network activity in the most transparent way and offer much convenient experience.
The new network map website provides many information about the Online.net network: It shows the aggregate bandwidth IN & OUT graphs for each datacenter and global external traffic. You can consult the current network activity of each router room in DC2, DC3 and AMS1. You can also get the current activity for each transit link.
We use networkmap.js, a network weather map written in Javascript for the UI. That allowed us to provide the map directly in the browser.
Transit links are displayed in three different sizes:
- Smallest links are representing a capacity of 10Gbit/s
- Medium links are representing a capacity of 100Gbit/s
- Biggest are representing a capacity of more than 100Gbit/s
We hope you will love this new network wheather map. We'd like to know your opinion, feedback and answer your questions about Netmap, so please leave us a comment here or join us on the community platform.
0 комментариев
Вставка изображения
Оставить комментарий